

Retail analytics have come a long way. Now, retailers are empowered to make strategic business decisions based on real information—not just gut instinct. Data analytics has the power of transforming every aspect of a retail business, providing valuable insights for every department from logistics to management, marketing, and sales.
There’s always going to be data-hungry retailers are everywhere. One survey by Alteryx and Retail Wire found that 81% of brands gather shopper insights, and 76% consider insights to be critical to their performance. However, most aren’t really doing anything with the generated data. Only 16% would call themselves experts when it comes to data analysis with 24% and 60%, respectively, being self-described as “newbies” and “getting there.”
As a result, our Retail Analytics Dashboards; powered by Tableau, help make data gathering, collation and presentation for retailers a breeze.
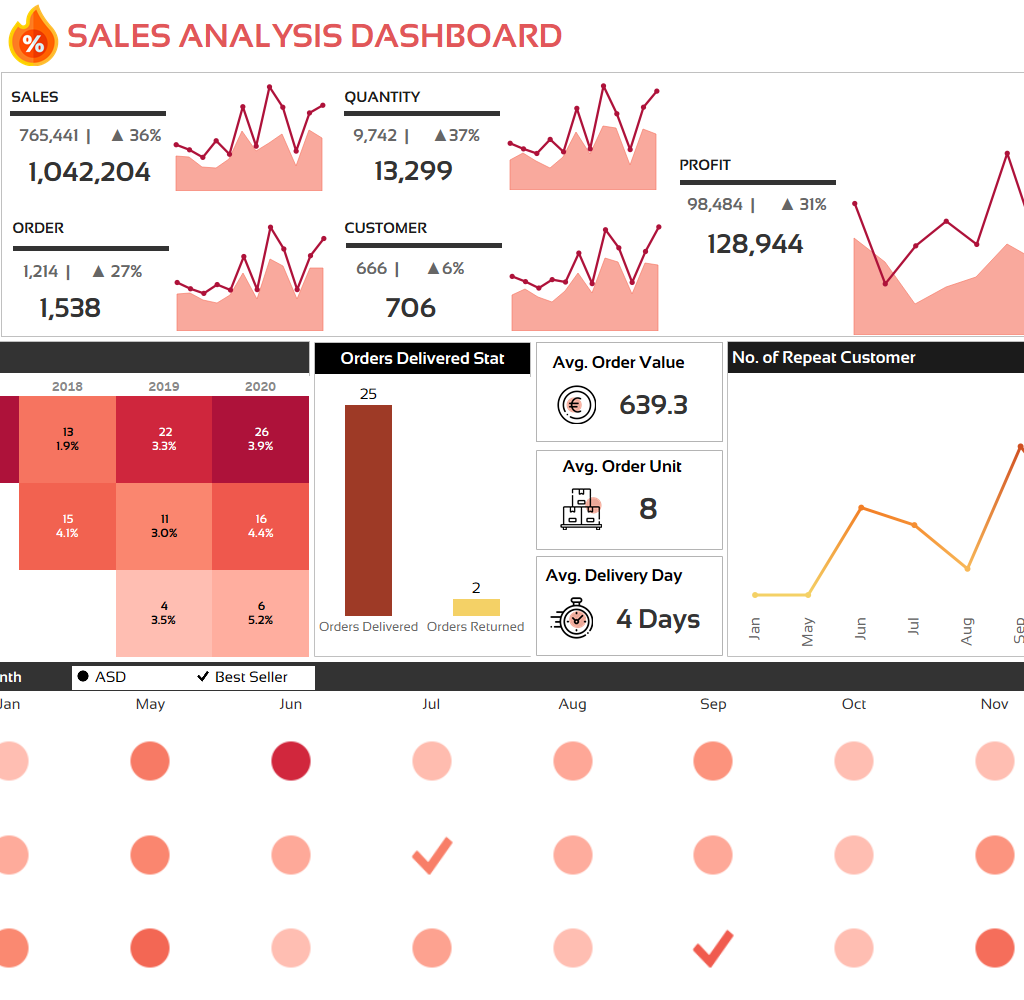
Sales Analytics Dashboard
- This Dashboard will help to understand the Sales Status specifically target vs achievement status in company level to even an individual outlet level.
- Users can get a brief idea on how many invoices were issues during the last day, how many customers traded yesterday, among them what is the status of registered customer a what was the profit.
- There are 3 months trend analysis to understand the basic sales pattern, whether the company sales show an increase or not, if sales fall then why it might be as well as the correlation of seasonal impact/weekend sales.
- Year on Year | Month on Month | Day on Day overview to understand business growth.
- Feasibility to observe the sales on department level, which will help the management understand the department level contribution and where to focus sales and/or marketing means.
Operation Management Dashboard
- This dashboard is very versatile as any management needs to have a clear picture about their stock amount and the availability of purchase requirements.
- In this dashboard, the management can get an overview of their current stock amounts along with weekly trend analysis to understand the basic business overview.
- Segregation of purchase requests from company level to individual department level and even in outlet level. While wastage is still one of the main hinderance for business growth, managements can also briefly view wastage levels for overall, outlet and even in individual department level.
- Sell through amount overview can also be monitored with the price movements and fluctuations overview. Long trend feasibility for observer is available with regards to the business movements.
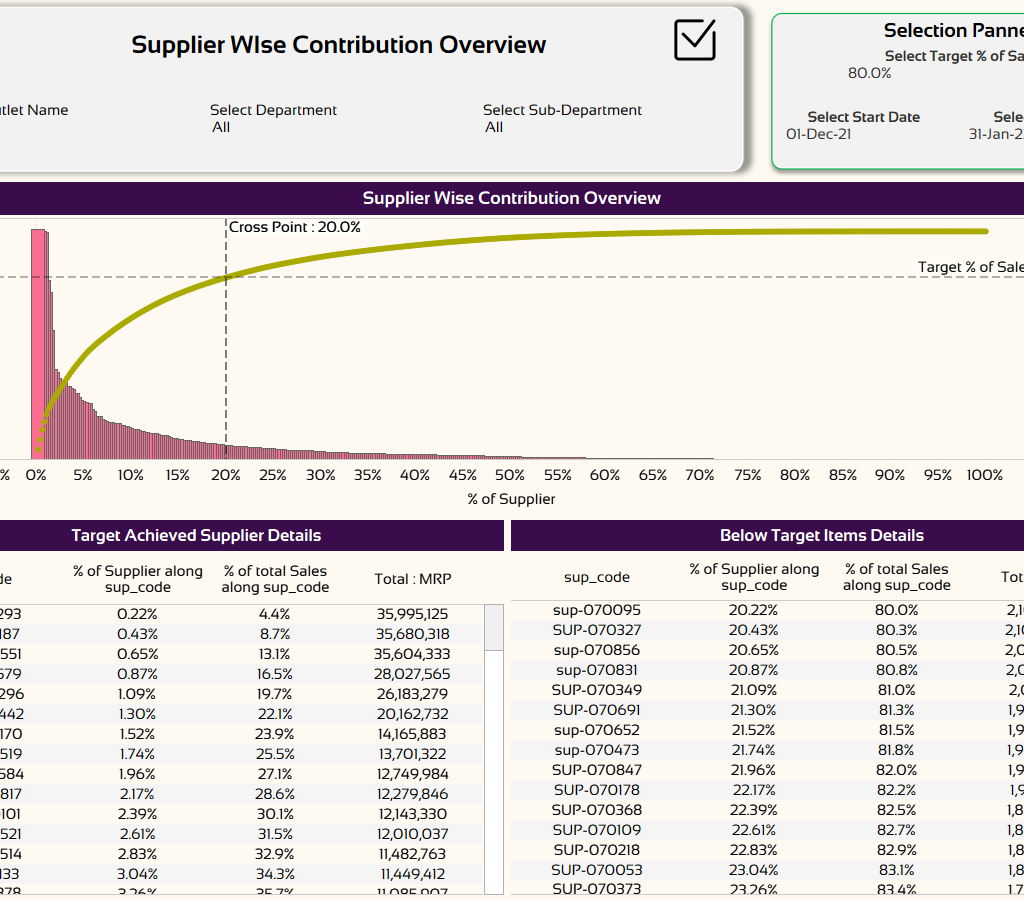
Supplier/ Item Analytics Dashboard
- Having the correct product, at the correct inventory levels, in the correct stores is one of the biggest challenges retailers face today.
- In this dashboard, the management can view the profitability scores based on supplier/item level in an interactive manner by selecting the profit ratios and sales amounts to understand the overview of managing the chosen supplier/Items.
- This dashboard will also provide Pareto chart analysis to understand the Business contribution matrix (80% & 20%) rules to understand the overview. This dashboard is also fairly interactive.
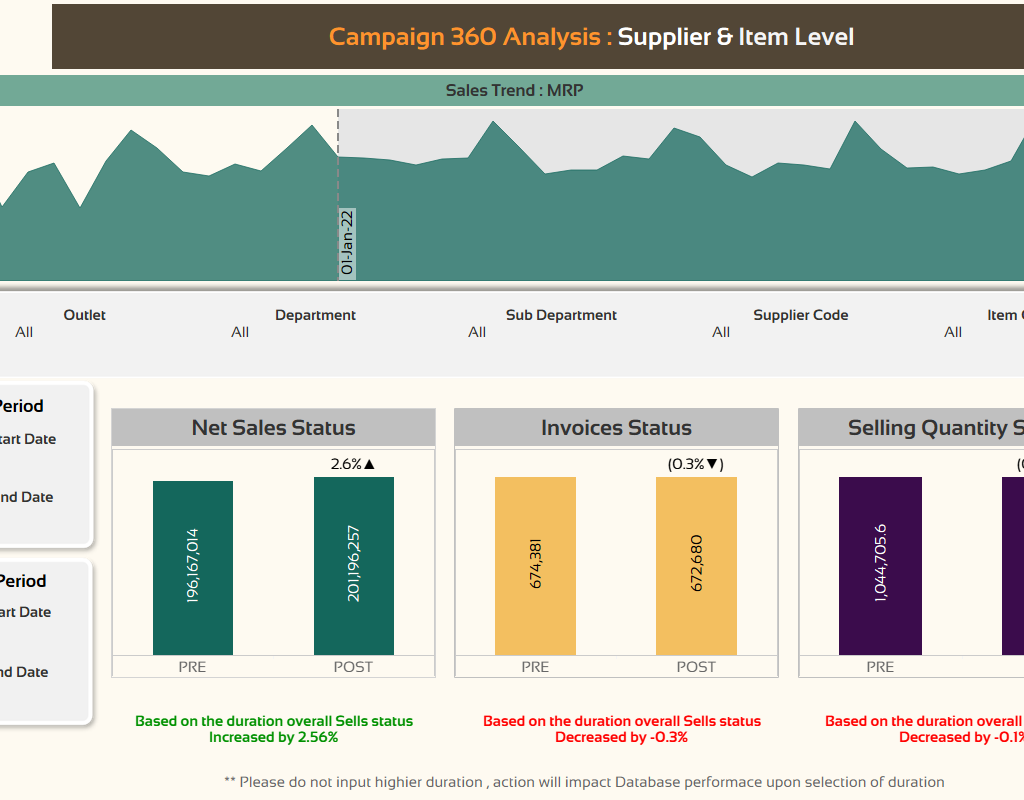
- Most importantly, the dashboard can also provide campaign-based analysis with regards to the PRE/POST scenario. Users can check on either a company level or the specific department or supplier/item.
Customer 360 Analysis Dashboard
- Customer analysis has now become the most important part of any business’s growth factor. In this dashboard, the management can get a brief overview of their customer behavior.
- Questions such as how many registered customers, how many registered in running month, how many of them are not trading, what about their average buying amount can be answered.
- Various weekly trends of customers can provide insights as how many of them are converting to repeating customer and becoming a registered customer.
- Locality, age, gender, occupation level summary
- Loyalty points level analysis including trading overview, silent customer overview, top customer interactive view based on flexible filtering of measures.
- Birthday overview & provisions to download all the necessary data for actions
Retail analytics strengthens the bond between a shop and its customers by providing useful information about consumer behavior. It enables the store to deliver the appropriate information to the appropriate audience in order to guarantee a positive and ultimately an enjoyable experience for the customer in the long run.