In a world grappling with the pandemic, trust in data has become paramount. With allegations of data manipulation and concealment, the need to democratize data has never been more pressing. As data becomes the lifeline for informed decisions, ensuring transparent and holistic data governance is vital for both governments and corporates. Dive into the challenges, solutions, and the imperative of data democratization in these unprecedented times.
Data is a powerful tool in today’s digital age, driving the global economy and shaping the way businesses operate. Modern reporting tools demand interactivity and fast data refresh rates. Raw tables or primary data sources often fall short in meeting these demands. The solution? Data Marts. These are specialized subsets of data warehouses designed for specific departments or functions within an organization. They provide easier access to data, improving database performance and allowing businesses to focus on optimization.
Explore the mindset for retail industry analytics, from tracking inventory and detecting trends to building a data culture. Learn how to leverage data for strategic impact, uncover hidden value, and drive growth with Tableau Analytics. Insights and real-world examples included.
With so much information being collected through data analysis in the business world today, we must find a way to paint a picture with that data so that we can interpret it. Data visualisation gives us a clear idea of what the information means by giving it visual context through maps or graphs. This makes the data more natural for the human mind to comprehend and therefore makes it easier to identify trends, patterns, and outliers within large data sets.
Data visualisation is one of the steps of the data science process, which states that after data has been collected, processed and modelled, it must be visualised for conclusions to be made. Data visualisation is also an element of the broader data presentation architecture (DPA) discipline, which aims to identify, locate, manipulate, format and deliver data in the most efficient way possible.
A good data visualisation combines three key aspects
Data on a topic with a precise angle
An efficient and purposeful visual
A design that is impactful but balanced
Since our eyes can capture the colours and patterns, therefore, we can quickly identify the red portion from blue, square from the circle, our culture is visual, including everything from art and advertisements to TV and movies. So, Data visualisation is another technique of visual art that grabs our interest and keeps our main focus on the message captured with the help of eyes. Whenever we visualise a chart, we quickly identify the trends and outliers present in the dataset.
It’s hard to think of a professional industry that doesn’t benefit from making data more understandable. Every STEM field benefits from understanding data—and so do fields in government, finance, marketing, history, consumer goods, service industries, education, sports, and so on. While we’ll always wax poetically about data visualisation there are practical, real-life applications that are undeniable. And, since visualisation is so prolific, it’s also one of the most useful professional skills to develop. The better you can convey your points visually, whether in a dashboard or a slide deck, the better you can leverage that information. The concept of the citizen data scientist is on the rise. Skill sets are changing to accommodate a data-driven world. It is increasingly valuable for professionals to be able to use data to make decisions and use visuals to tell stories of when data informs the who, what, when, where, and how. While traditional education typically draws a distinct line between creative storytelling and technical analysis, the modern professional world also values those who can cross between the two: data visualisation sits right in the middle of analysis and visual storytelling.
Retail analytics have come a long way. Now, retailers are empowered to make strategic business decisions based on real information—not just gut instinct. Data analytics has the power of transforming every aspect of a retail business, providing valuable insights for every department from logistics to management, marketing, and sales.
There’s always going to be data-hungry retailers are everywhere. One survey by Alteryx and Retail Wire found that 81% of brands gather shopper insights, and 76% consider insights to be critical to their performance. However, most aren’t really doing anything with the generated data. Only 16% would call themselves experts when it comes to data analysis with 24% and 60%, respectively, being self-described as “newbies” and “getting there.”
As a result, our Retail Analytics Dashboards; powered by Tableau, help make data gathering, collation and presentation for retailers a breeze.
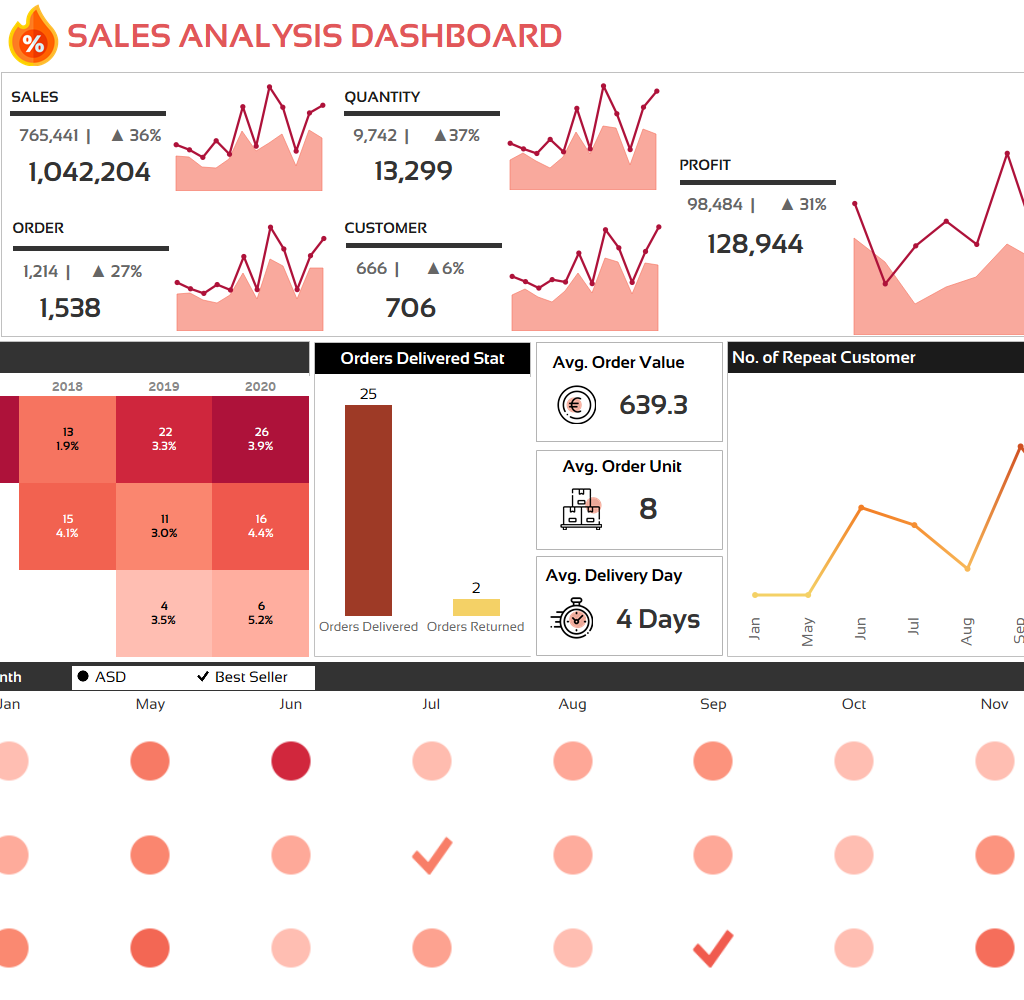
Sales Analytics Dashboard
This Dashboard will help to understand the Sales Status specifically target vs achievement status in company level to even an individual outlet level.
Users can get a brief idea on how many invoices were issues during the last day, how many customers traded yesterday, among them what is the status of registered customer a what was the profit.
There are 3 months trend analysis to understand the basic sales pattern, whether the company sales show an increase or not, if sales fall then why it might be as well as the correlation of seasonal impact/weekend sales.
Year on Year | Month on Month | Day on Day overview to understand business growth.
Feasibility to observe the sales on department level, which will help the management understand the department level contribution and where to focus sales and/or marketing means.
Operation Management Dashboard
This dashboard is very versatile as any management needs to have a clear picture about their stock amount and the availability of purchase requirements.
In this dashboard, the management can get an overview of their current stock amounts along with weekly trend analysis to understand the basic business overview.
Segregation of purchase requests from company level to individual department level and even in outlet level. While wastage is still one of the main hinderance for business growth, managements can also briefly view wastage levels for overall, outlet and even in individual department level.
Sell through amount overview can also be monitored with the price movements and fluctuations overview. Long trend feasibility for observer is available with regards to the business movements.
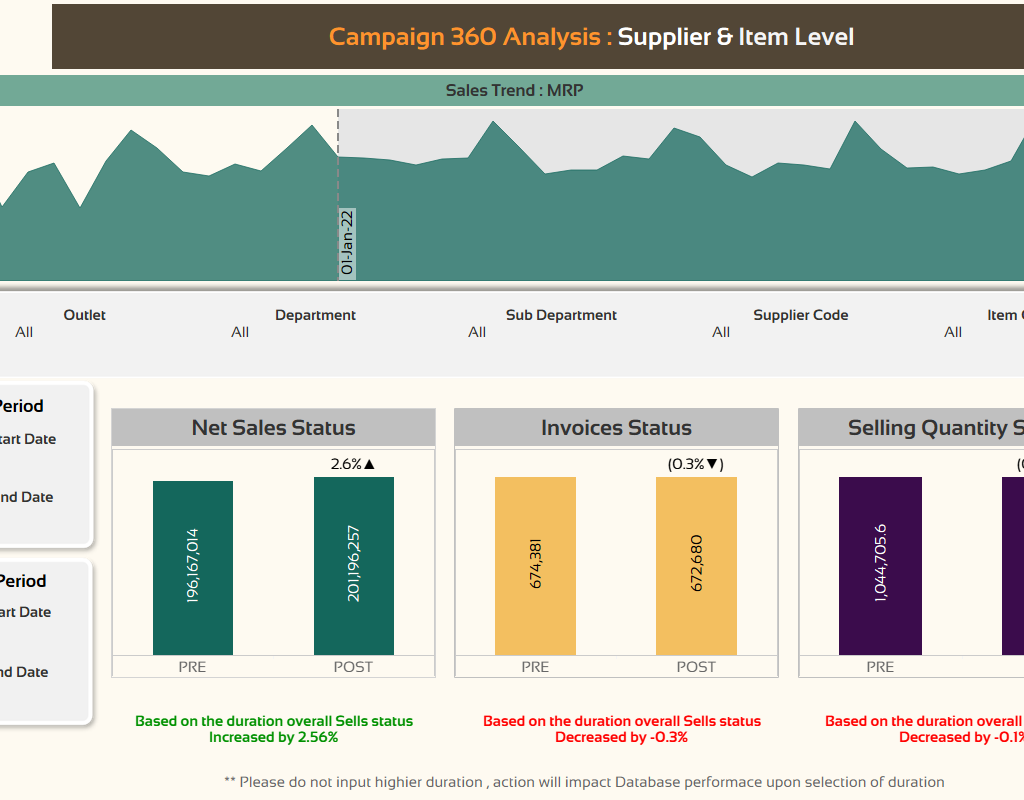
Supplier/ Item Analytics Dashboard
Having the correct product, at the correct inventory levels, in the correct stores is one of the biggest challenges retailers face today.
In this dashboard, the management can view the profitability scores based on supplier/item level in an interactive manner by selecting the profit ratios and sales amounts to understand the overview of managing the chosen supplier/Items.
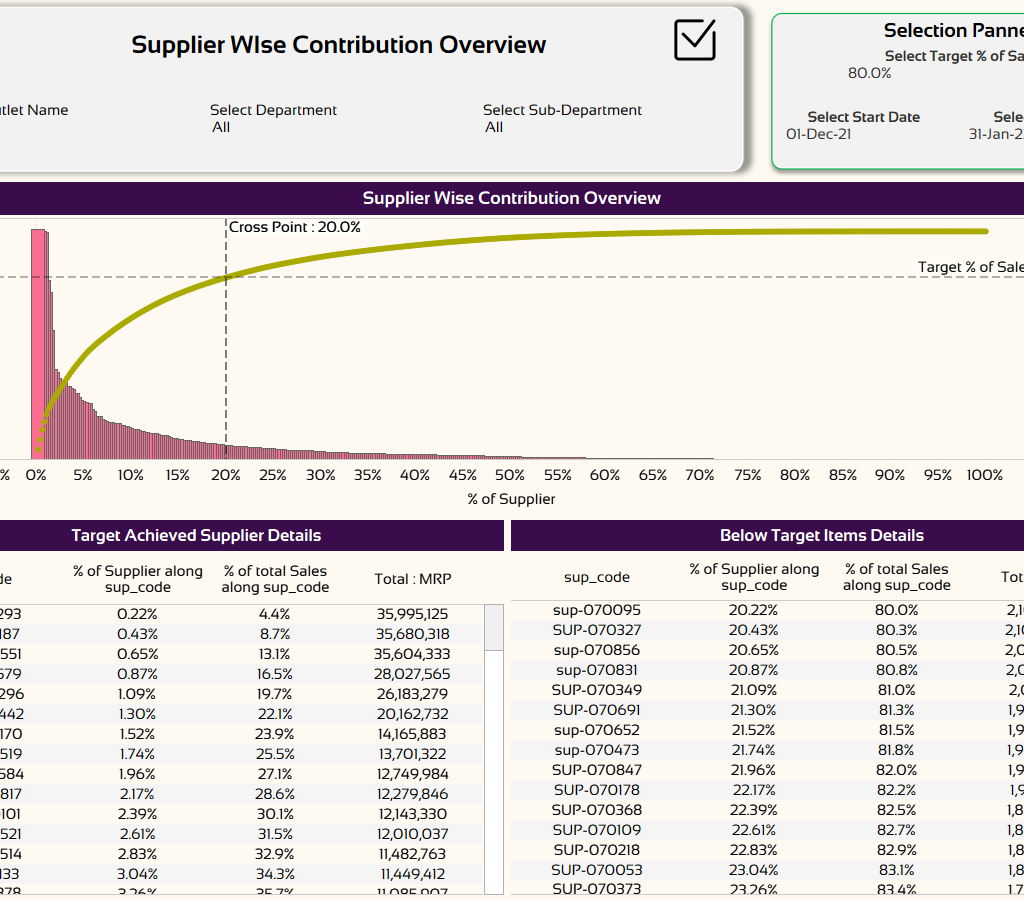
This dashboard will also provide Pareto chart analysis to understand the Business contribution matrix (80% & 20%) rules to understand the overview. This dashboard is also fairly interactive.
Most importantly, the dashboard can also provide campaign-based analysis with regards to the PRE/POST scenario. Users can check on either a company level or the specific department or supplier/item.
Customer 360 Analysis Dashboard
Customer analysis has now become the most important part of any business’s growth factor. In this dashboard, the management can get a brief overview of their customer behavior.
Questions such as how many registered customers, how many registered in running month, how many of them are not trading, what about their average buying amount can be answered.
Various weekly trends of customers can provide insights as how many of them are converting to repeating customer and becoming a registered customer.
Locality, age, gender, occupation level summary
Loyalty points level analysis including trading overview, silent customer overview, top customer interactive view based on flexible filtering of measures.
Birthday overview & provisions to download all the necessary data for actions
Retail analytics strengthens the bond between a shop and its customers by providing useful information about consumer behavior. It enables the store to deliver the appropriate information to the appropriate audience in order to guarantee a positive and ultimately an enjoyable experience for the customer in the long run.
Explore the critical role of data analytics in today’s business landscape. From descriptive to cognitive analytics, learn how data analysis drives decision-making, enhances customer sentiment, and shapes market research. Real-world examples and insights included.